Custom Dashboard Interface
Modular visual control panels built for structured operational data, multi-source reporting, and dynamic parameter organization.
Structured Data Layouts with Complete Workspace Flexibility
Modern corporate intelligence depends on fast access to relevant KPIs without sorting through disconnected spreadsheets or rigid monolithic panels.
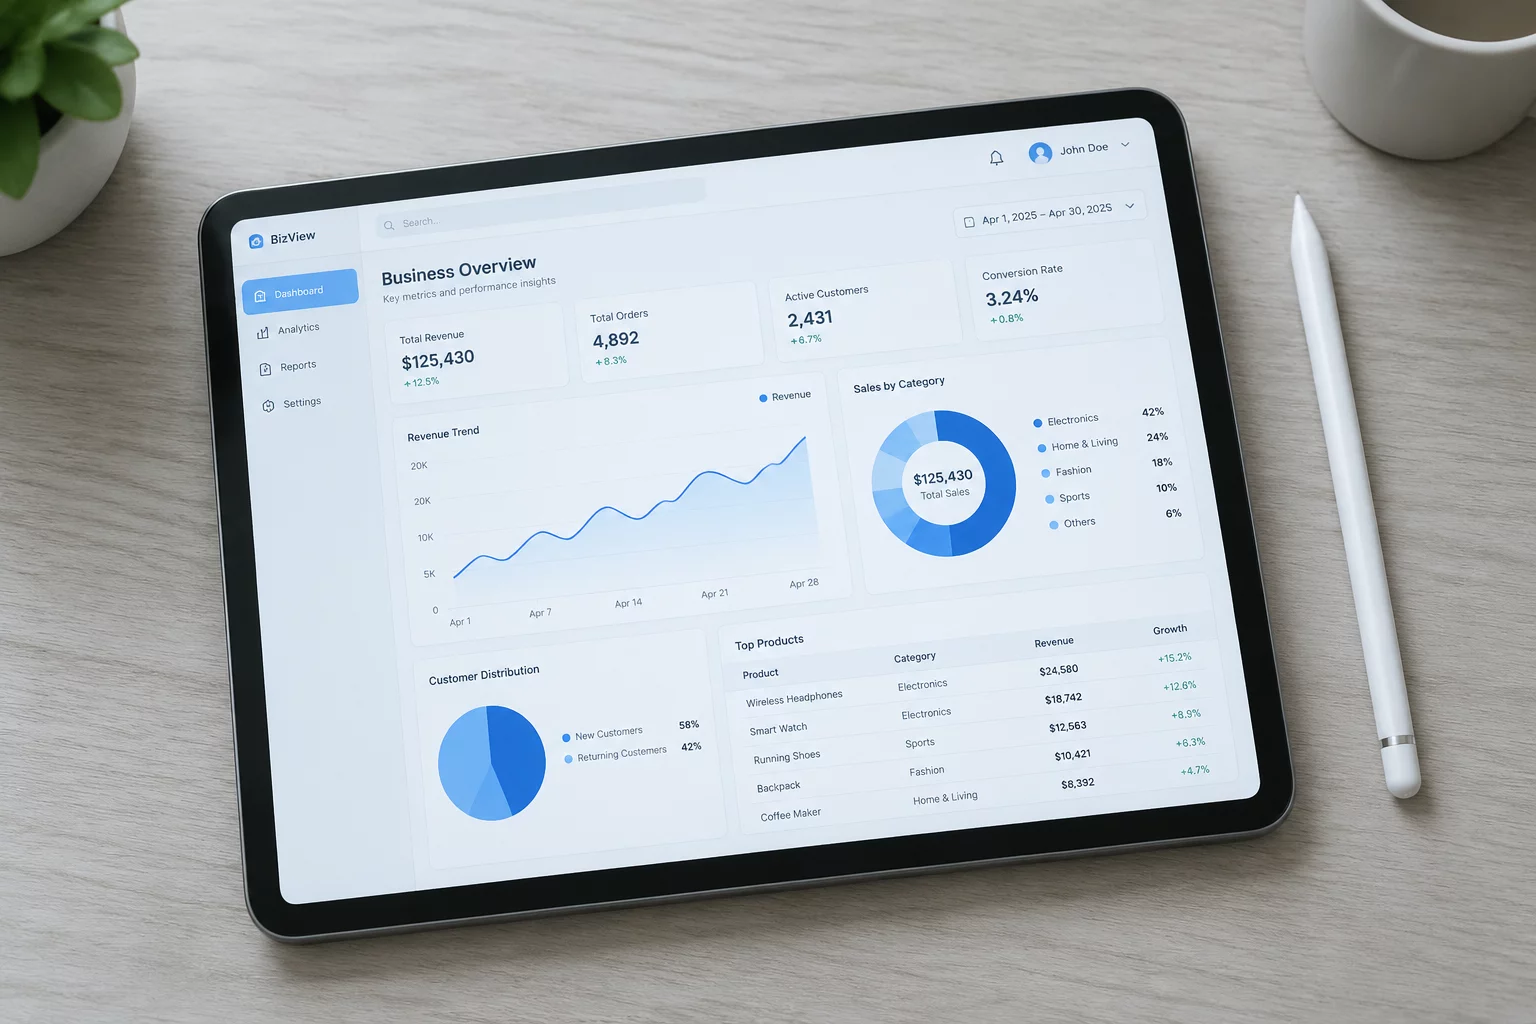
The Custom Dashboard Interface allows analytical teams to assemble dedicated operational views matching their exact data hierarchy. Users arrange visual widgets across an adaptive coordinate grid, grouping complex performance indicators, trend curves, and categorical breakdowns into unified presentation views. Every module retains direct references to underlying data structures, maintaining precision across multiple data sources.
With automated data refreshing and modular widget configurations, teams can isolate critical parameters, cross-examine multi-entity metrics, and establish role-specific perspectives. The interface provides consistent visualization across high-resolution desktop environments and mobile tablets, ensuring decision-makers preserve context wherever operational reviews take place.
Request Custom Dashboard Technical Specifications
Receive our complete implementation guide detailing layout architecture, widget protocols, and data connectivity standards.
Interface Architecture and Functional Parameters
A structured overview of core interface attributes, data synchronization intervals, and responsive rendering specifications.
| Attribute | Specification Details | Platform Tier |
|---|---|---|
| Grid Flexibility | 12-column adaptive snap grid with dynamic card nesting and manual dimension scaling | Core & Enterprise |
| Widget Library | Over 28 pre-built analytical modules including line clusters, heat maps, and categorical tables | Standard Included |
| Data Refresh Cadence | Real-time streaming handshakes or automated periodic batch syncing every 60 seconds | High Performance |
| Export Compatibility | Vector PDF summary snapshots, formatted CSV exports, and structured JSON data feeds | Enterprise Ready |
Core Functional Capabilities of the Dashboard System
Explore the four foundational pillars that make our custom visual environment reliable, intuitive, and secure.
Unified Multi-Source Aggregation
Connect data points from enterprise pipelines, relational repositories, and structured files without manual formatting or redundant transformations.
Dynamic Parameter Filtering
Apply universal date ranges, sector filters, and threshold criteria that instantly update all dependent visual widgets simultaneously.
Role-Based View Governance
Assign customized workspace presets to specific organizational departments, ensuring individuals only inspect data relevant to their role.
Asynchronous Layout Engine
Render heavy numerical charts smoothly with client-side hardware acceleration, preventing interface latency during complex queries.
Frequently Asked Questions
Clear answers to common questions about setting up, personalizing, and maintaining custom dashboard configurations.
Yes. Users can publish customized dashboard configurations as shared templates or keep them restricted to individual user profiles with fine-grained read-only permissions.
Complementary Platform Capabilities
Combine your custom dashboard setup with our analytical tools to gain complete visibility across every data stream.

Portfolio Insights Tool
Identifies asset concentration and sector risks using advanced mathematical modeling and structured risk metrics.
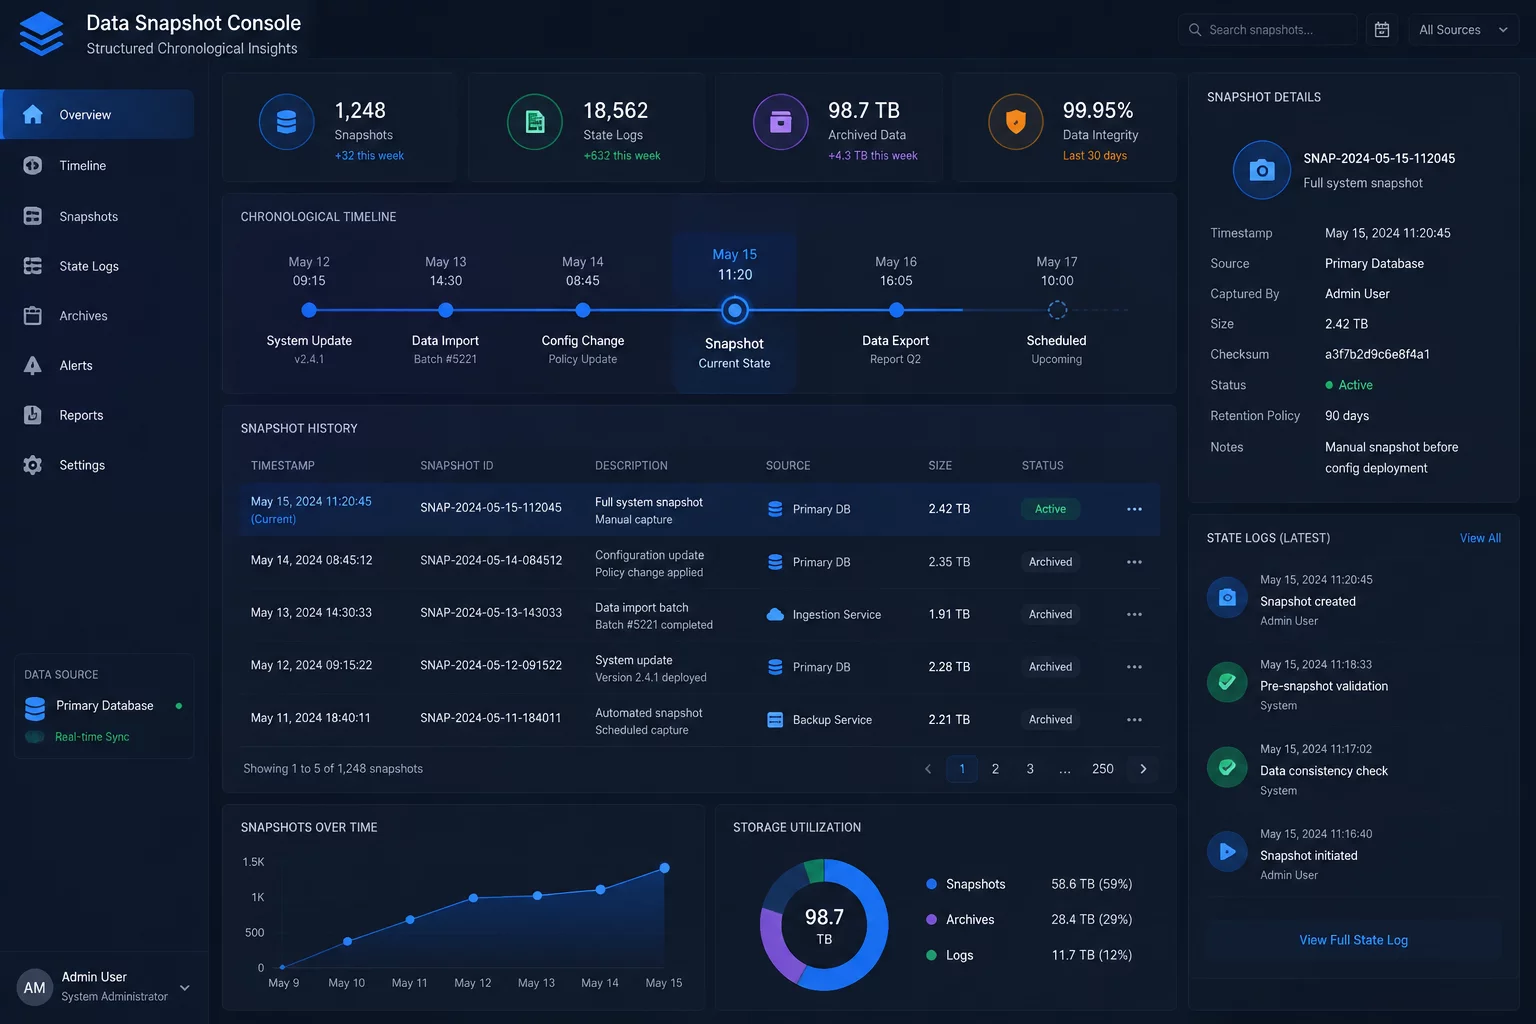
Portfolio Snapshot Capability
Capture and archive point-in-time state records to evaluate corporate asset configurations across custom timelines.